


AuctionGate | Account management - Site page "Dashboard"
The "Dashboard" page contains summary information on the main sections and allows quick access to the necessary sections for further work.
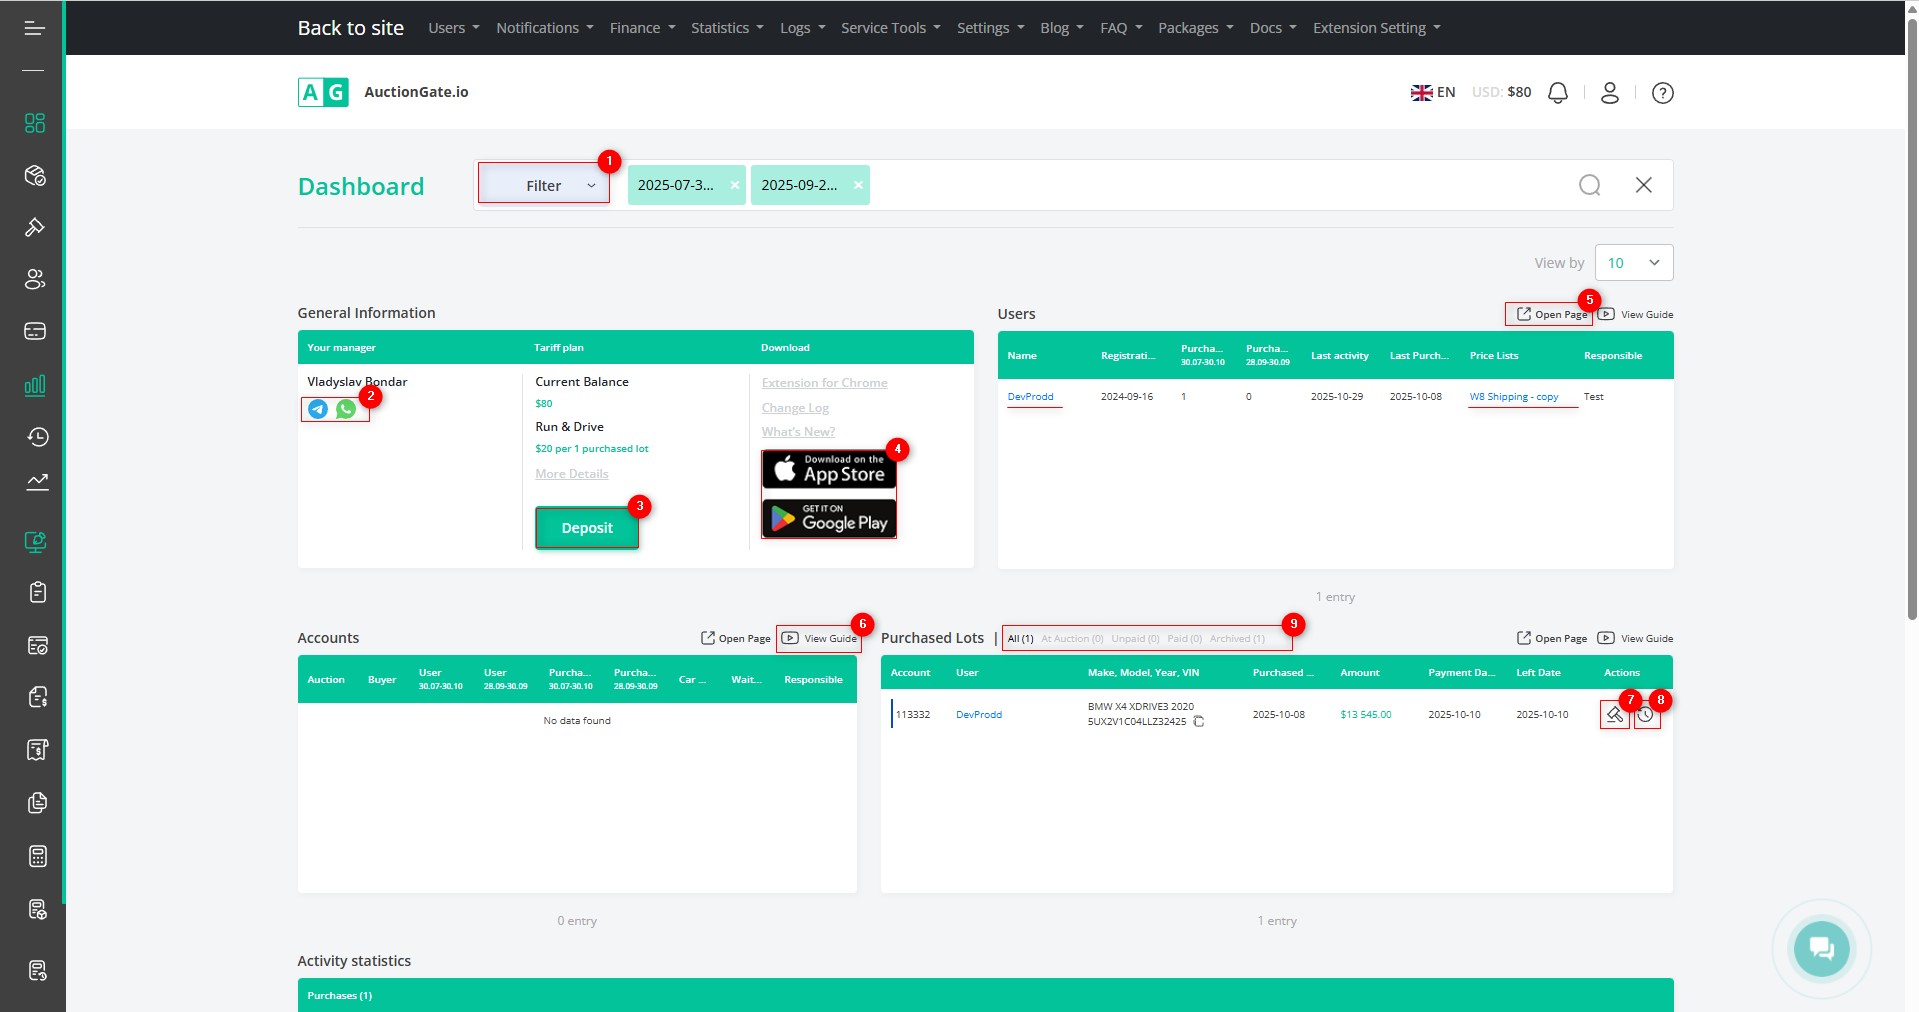
Figure 1 – "Dashboard" site page
To configure data display parameters, click the “Filter” button (Figure 1, Pointer 1). This will open the filter window, which allows you to set filter parameters (Figure 2):
-
“VIN, Make, Model, Year” – enter the required value to be used for filtering;
-
“Purchase Date” – specify a particular date or a time range for the search.
Note: The “Filter” window also provides a comparison function (Figure 2, Pointer 3). When you toggle the “Compare with Interval by Purchased Date” switch, an additional field “ Comparison Date Range” appears, where you need to specify the period for which the data will be compared.
-
“Account” – from the dropdown list that appears when you click the button
 , select the required account;
 -
“Price List” – select the price list from the dropdown menu;
-
“Responsible” – select the person in charge from the dropdown list;
-
“Payment Date” – set the required payment date for the lot;
-
“Left Location Date” – set the date the vehicle leaves the location;
-
“Auction” – select the required auction from the dropdown list;
-
“Client” – select the client from the dropdown list;
-
“Office” – select the auction office from the dropdown list.
Note: You can set one or several parameters to perform a search.
The search bar allows searching by any parameter (Figure 2, Pointer 1). To do this, enter any query and click the button ![]() located in the search bar or press the “Enter” key on your keyboard. As a result, the records matching the entered parameters will be displayed on the page.
located in the search bar or press the “Enter” key on your keyboard. As a result, the records matching the entered parameters will be displayed on the page.
To clear the entire search window and reset the filter, click the corresponding button ![]() . If you need to remove only one parameter, click the cross icon located in the query field itself (Figure 2, Pointer 2).
. If you need to remove only one parameter, click the cross icon located in the query field itself (Figure 2, Pointer 2).
After setting the parameters, click the “Apply” button to confirm, or “Clear” to cancel.
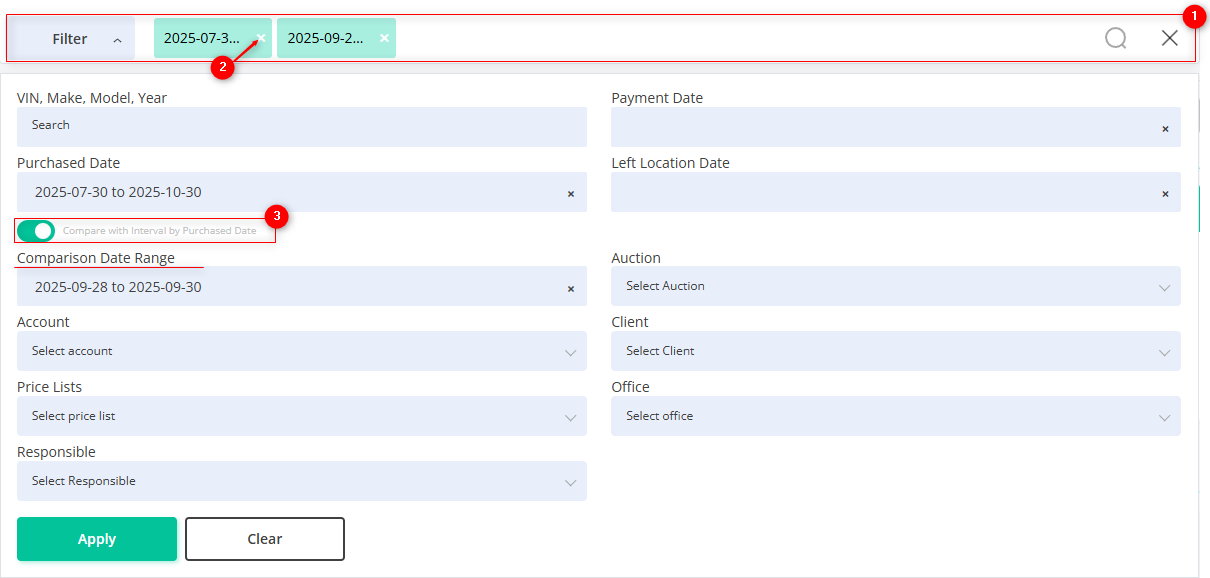
Figure 2 – Filter window
The page also contains several informational blocks:
1. “General Information” – this block displays the following fields:
-
“Your Manager” – provides information about the manager you are working with, including their name. By clicking the messenger icons (Figure 1, Pointer 2), you will be redirected to the corresponding messenger page to contact the manager.
-
“Tariff Plan” – shows information about your current plan. Clicking the “Deposit” button (Figure 1, Pointer 3) will redirect you to page in the “Balance” section, where you can top up your plan if desired.
-
“Download” – provides information about the available Chrome extension. Clicking the icons (Figure 1, Pointer 4) will redirect you to the browser page where you can download the extension.
2. “Users” – this block displays brief information about your users.
Note: In each block, there is an option to navigate to the page represented by that block for a more detailed view. To do this, click the corresponding button
![]() (Figure 1, Pointer 5). Click the button to navigate to the corresponding page.
(Figure 1, Pointer 5). Click the button to navigate to the corresponding page.![]() (Figure 1, Pointer 6) opens a window with a video tutorial.
(Figure 1, Pointer 6) opens a window with a video tutorial.
3. “Accounts” – this block displays information about the available accounts.
4. “Purchased Lots” – this block contains information about the lots you have purchased, with the option to view lot statistics by clicking the corresponding button ![]() (Figure 1, Pointer 7) and view the lot history by clicking the corresponding button
(Figure 1, Pointer 7) and view the lot history by clicking the corresponding button![]() (Figure 1, Pointer 8). At the top of the information block, there is also a counter bar with the following categories: “All”, “Paid”, “Unpaid”, “At Auction”, “Archived” (Figure 1, Pointer 9).
(Figure 1, Pointer 8). At the top of the information block, there is also a counter bar with the following categories: “All”, “Paid”, “Unpaid”, “At Auction”, “Archived” (Figure 1, Pointer 9).
5. “Activity statistics” – displays a chart showing the dynamics of purchased lots over the selected period. When the comparison function in the filter is activated, the chart shows two indicators: the main period (solid line) and the comparison period (dashed line), allowing for a clear comparison of results over different time intervals (Figure 3).
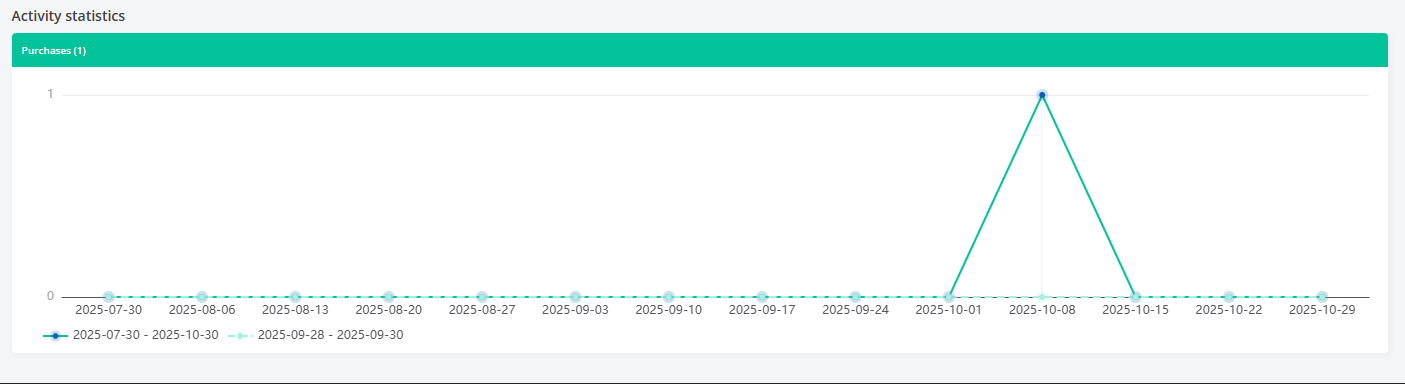
Figure 3 – Activity Statistics Chart